


profiling trace files with preprocessor external tables in 11g
External tables were introduced in Oracle 9i but have had several new features added through the major releases of 10g and 11g. In particular, Oracle 11g added a range of support for compression, both in reading and writing data with external tables. The external table preprocessor (released in the 11.1.0.7 patchset) was possibly developed to enable the reading of compressed files but as we will see in this article, it can be used for other types of preprocessing tasks. In particular, we will be using the preprocessor to generate and read TKProf and OraSRP reports from trace files, all within SQL*Plus (or any other IDE of choice, such as SQL Developer, TOAD etc).
For a full description of the external table preprocessor and its capabilities, there are two oracle-developer.net articles available:
- External table enhancements in 11g describes all external table new features in 11g, including an example of the preprocessor being used to read from compressed files;
- Listing files with the external table preprocessor in 11g provides examples of using the preprocessor to get file listings and describes the security implications of the new feature.
Readers who are unfamiliar with the external table preprocessor feature should read the articles listed above. Some of the concepts described in them will not be repeated in the following article.
oracle directory setup
As with any external table, we need to begin by creating an Oracle directory to read our external files. As this article is related to generating profiler reports from extended SQL trace files, we need to create a directory over the user dump destination, as follows.
SQL> conn / as sysdba
Connected.
SQL> CREATE DIRECTORY trace_dir AS '/app/oracle/diag/rdbms/ora112/ORA112/trace';
Directory created.
We also need to grant our user both READ and WRITE privileges on this directory (READ to enable reading both the raw SQL trace files and the profiler reports and WRITE to generate the profiler reports), as follows.
SQL> GRANT READ, WRITE ON DIRECTORY trace_dir TO scott;
Grant succeeded.
In addition to a "standard" read/write directory, we also need an executable directory for our preprocessor scripts (as already stated, the background reading has full descriptions of all preprocessor concepts).
SQL> CREATE DIRECTORY bin_dir AS '/app/oracle/bin_dir';
Directory created.
SQL> GRANT EXECUTE ON DIRECTORY bin_dir TO scott;
Grant succeeded.
The executable directory is created in the same way as any other, but this time we have granted an EXECUTE privilege to our user. The executable directory will contain the preprocessor scripts needed to generate and read the profiler reports. Naturally, this has security implications, as described in the recommended reading and we'll assume for this article that the /app/oracle/bin_dir directory is strictly controlled.
generating and reading tkprof reports
Now that we have our Oracle directories, we can connect as our user and create an external table to generate and read TKProf reports, as follows.
SQL> conn scott/tiger
Connected.
SQL> CREATE TABLE tkprof_xt
  2  ( line  NUMBER
  3  , text  VARCHAR2(4000)
  4  )
  5  ORGANIZATION EXTERNAL
  6  (
  7    TYPE ORACLE_LOADER
  8    DEFAULT DIRECTORY trace_dir
  9    ACCESS PARAMETERS
 10    (
 11       RECORDS DELIMITED BY NEWLINE
 12       NOLOGFILE
 13       PREPROCESSOR bin_dir: 'tkprof.sh'
 14       FIELDS TERMINATED BY WHITESPACE
 15       (
 16          line RECNUM
 17       ,  text POSITION(1:4000)
 18       )
 19    )
 20    LOCATION ('')
 21  )
 22  REJECT LIMIT UNLIMITED;
Table created.
As highlighted, this is a preprocessor external table. Its data source is not a flat-file, but rather the output of the preprocessor script highlighted on line 21. The location clause on line 20 is unnecessary at create-time, but before we can query the external table, we'll need to provide a valid trace file (which we'll see later).
The preprocessor script that supports this external table is very simple, as follows.
[oracle@oel bin_dir]$ cat tkprof.sh
#!/bin/ksh
${ORACLE_HOME}/bin/tkprof $1 $1.prf
/bin/cat $1.prf
Obviously, this is a shell script for a *nix system but is simple to convert to a Windows batch-file equivalent. The preprocessor script simply generates and reads a TKProf report for the trace file provided as parameter $1 (as noted in the background reading, this $1 parameter is the name of the file set as the external table's location).
To test our external table, we'll generate an extended SQL trace file as follows.
SQL> ALTER SESSION SET EVENTS '10046 trace name context forever, level 12';
Session altered.
SQL> SELECT COUNT(*) FROM emp;
  COUNT(*)
----------
        14

1 row selected.
SQL> ALTER SESSION SET EVENTS '10046 trace name context off';
Session altered.
As long as we retain our database session, we can determine the name of the trace file we generated by querying the V$DIAG_INFO view, as follows.
SQL> SELECT REGEXP_SUBSTR(value, '[^/]+$') AS trace_file
  2  FROM   v$diag_info
  3  WHERE  name = 'Default Trace File';
TRACE_FILE
------------------------
ORA112_ora_5107.trc

1 row selected.
Now we have the name of our trace file, we can set the external table's location clause, as follows.
SQL> ALTER TABLE tkprof_xt LOCATION ('ORA112_ora_5107.trc');
Table altered.
We're now ready to generate and read a TKProf report for this trace file, which is as simple as querying the TKPROF_XT table, as below.
SQL> SELECT *
  2  FROM   tkprof_xt;
   LINE TEXT
------- --------------------------------------------------------------------------------
      1
      2 TKPROF: Release 11.2.0.2.0 - Development on Tue Nov 8 07:34:21 2011
      3
      4 Copyright (c) 1982, 2009, Oracle and/or its affiliates.  All rights reserved.
      5
      6
      7
      8 TKPROF: Release 11.2.0.2.0 - Development on Tue Nov 8 07:34:21 2011
      9
     10 Copyright (c) 1982, 2009, Oracle and/or its affiliates.  All rights reserved.
     11
     12 Trace file: /app/oracle/diag/rdbms/ora112/ORA112/trace/ORA112_ora_5107.trc
     13 Sort options: default
     14
     15 ********************************************************************************
     16 count    = number of times OCI procedure was executed
     17 cpu      = cpu time in seconds executing
     18 elapsed  = elapsed time in seconds executing
     19 disk     = number of physical reads of buffers from disk
     20 query    = number of buffers gotten for consistent read
     21 current  = number of buffers gotten in current mode (usually for update)
     22 rows     = number of rows processed by the fetch or execute call
     23 ********************************************************************************
     24
     25 SQL ID: 9babjv8yq8ru3 Plan Hash: 0
     26
     27 BEGIN DBMS_OUTPUT.GET_LINES(:LINES, :NUMLINES); END;
     28
     29
     30 call     count       cpu    elapsed       disk      query    current        rows
     31 ------- ------  -------- ---------- ---------- ---------- ----------  ----------
     32 Parse        2      0.00       0.00          0          0          0           0
     33 Execute      2      0.00       0.02          0          3          0           2
     34 Fetch        0      0.00       0.00          0          0          0           0
     35 ------- ------  -------- ---------- ---------- ---------- ----------  ----------
     36 total        4      0.00       0.02          0          3          0           2
     37
     38 Misses in library cache during parse: 0
     39 Optimizer mode: ALL_ROWS
     40 Parsing user id: 84
     41
     42 Elapsed times include waiting on following events:
     43   Event waited on                             Times   Max. Wait  Total Waited
     44   ----------------------------------------   Waited  ----------  ------------
     45   SQL*Net message to client                       2        0.00          0.00
     46   SQL*Net message from client                     2        0.00          0.00
     47 ********************************************************************************
     48
     49 SQL ID: 1srhq04p4x0zz Plan Hash: 2083865914
     50
     51 SELECT /* OPT_DYN_SAMP */ /*+ ALL_ROWS IGNORE_WHERE_CLAUSE
     52   NO_PARALLEL(SAMPLESUB) opt_param('parallel_execution_enabled', 'false')
     53   NO_PARALLEL_INDEX(SAMPLESUB) NO_SQL_TUNE */ NVL(SUM(C1),:"SYS_B_0"),
     54   NVL(SUM(C2),:"SYS_B_1")
     55 FROM
     56  (SELECT /*+ NO_PARALLEL("EMP") FULL("EMP") NO_PARALLEL_INDEX("EMP") */
     57   :"SYS_B_2" AS C1, :"SYS_B_3" AS C2 FROM "SCOTT"."EMP" "EMP") SAMPLESUB
     58
     59
     60 call     count       cpu    elapsed       disk      query    current        rows
     61 ------- ------  -------- ---------- ---------- ---------- ----------  ----------
     62 Parse        1      0.00       0.00          0          0          0           0
     63 Execute      1      0.00       0.03          0          0          0           0
     64 Fetch        1      0.00       0.00          0          7          0           1
     65 ------- ------  -------- ---------- ---------- ---------- ----------  ----------
     66 total        3      0.00       0.03          0          7          0           1
     67
     68 Misses in library cache during parse: 1
     69 Misses in library cache during execute: 1
     70 Optimizer mode: ALL_ROWS
     71 Parsing user id: 84     (recursive depth: 1)
     72 Number of plan statistics captured: 1
     73
     74 Rows (1st) Rows (avg) Rows (max)  Row Source Operation
     75 ---------- ---------- ----------  ---------------------------------------------------
     76          1          1          1  SORT AGGREGATE (cr=7 pr=0 pw=0 time=340 us)
     77         14         14         14   TABLE ACCESS FULL EMP (cr=7 pr=0 pw=0 time=301 us cost=3 size=0 card=409)
     78
     79
     80 Elapsed times include waiting on following events:
     81   Event waited on                             Times   Max. Wait  Total Waited
     82   ----------------------------------------   Waited  ----------  ------------
     83   Disk file operations I/O                        1        0.00          0.00
     84 ********************************************************************************
     85
     86 SQL ID: 7ryz6qnvnq8zc Plan Hash: 1006289799
     87
     88 SELECT COUNT(*)
     89 FROM
     90  emp
     91
     92
     93 call     count       cpu    elapsed       disk      query    current        rows
     94 ------- ------  -------- ---------- ---------- ---------- ----------  ----------
     95 Parse        1      0.00       0.00          0          2          0           0
     96 Execute      1      0.00       0.00          0          0          0           0
     97 Fetch        2      0.00       0.00          0          4          0           1
     98 ------- ------  -------- ---------- ---------- ---------- ----------  ----------
     99 total        4      0.00       0.00          0          6          0           1
    100
    101 Misses in library cache during parse: 1
    102 Optimizer mode: ALL_ROWS
    103 Parsing user id: 84
    104 Number of plan statistics captured: 1
    105
    106 Rows (1st) Rows (avg) Rows (max)  Row Source Operation
    107 ---------- ---------- ----------  ---------------------------------------------------
    108          1          1          1  SORT AGGREGATE (cr=4 pr=0 pw=0 time=112 us)
    109         14         14         14   INDEX FAST FULL SCAN PK_EMP (cr=4 pr=0 pw=0 time=98 us cost=2 size=0 card=14)(object id 73182)
    110
    111
    112 Elapsed times include waiting on following events:
    113   Event waited on                             Times   Max. Wait  Total Waited
    114   ----------------------------------------   Waited  ----------  ------------
    115   SQL*Net message to client                       2        0.00          0.00
    116   SQL*Net message from client                     2        0.00          0.00
    117 ********************************************************************************
    118
    119 SQL ID: 0kjg1c2g4gdcr Plan Hash: 0
    120
    121 ALTER SESSION SET EVENTS '10046 trace name context off'
    122
    123
    124 call     count       cpu    elapsed       disk      query    current        rows
    125 ------- ------  -------- ---------- ---------- ---------- ----------  ----------
    126 Parse        1      0.00       0.00          0          0          0           0
    127 Execute      1      0.00       0.00          0          0          0           0
    128 Fetch        0      0.00       0.00          0          0          0           0
    129 ------- ------  -------- ---------- ---------- ---------- ----------  ----------
    130 total        2      0.00       0.00          0          0          0           0
    131
    132 Misses in library cache during parse: 0
    133 Parsing user id: 84
    134
    135
    136
    137 ********************************************************************************
    138
    139 OVERALL TOTALS FOR ALL NON-RECURSIVE STATEMENTS
    140
    141 call     count       cpu    elapsed       disk      query    current        rows
    142 ------- ------  -------- ---------- ---------- ---------- ----------  ----------
    143 Parse        4      0.00       0.00          0          2          0           0
    144 Execute      4      0.00       0.02          0          3          0           2
    145 Fetch        2      0.00       0.00          0          4          0           1
    146 ------- ------  -------- ---------- ---------- ---------- ----------  ----------
    147 total       10      0.00       0.02          0          9          0           3
    148
    149 Misses in library cache during parse: 1
    150
    151 Elapsed times include waiting on following events:
    152   Event waited on                             Times   Max. Wait  Total Waited
    153   ----------------------------------------   Waited  ----------  ------------
    154   SQL*Net message to client                       5        0.00          0.00
    155   SQL*Net message from client                     5        0.00          0.00
    156
    157
    158 OVERALL TOTALS FOR ALL RECURSIVE STATEMENTS
    159
    160 call     count       cpu    elapsed       disk      query    current        rows
    161 ------- ------  -------- ---------- ---------- ---------- ----------  ----------
    162 Parse        1      0.00       0.00          0          0          0           0
    163 Execute      1      0.00       0.03          0          0          0           0
    164 Fetch        1      0.00       0.00          0          7          0           1
    165 ------- ------  -------- ---------- ---------- ---------- ----------  ----------
    166 total        3      0.00       0.03          0          7          0           1
    167
    168 Misses in library cache during parse: 1
    169 Misses in library cache during execute: 1
    170
    171 Elapsed times include waiting on following events:
    172   Event waited on                             Times   Max. Wait  Total Waited
    173   ----------------------------------------   Waited  ----------  ------------
    174   Disk file operations I/O                        1        0.00          0.00
    175
    176     4  user  SQL statements in session.
    177     0  internal SQL statements in session.
    178     4  SQL statements in session.
    179 ********************************************************************************
    180 Trace file: /app/oracle/diag/rdbms/ora112/ORA112/trace/ORA112_ora_5107.trc
    181 Trace file compatibility: 11.1.0.7
    182 Sort options: default
    183
    184        1  session in tracefile.
    185        4  user  SQL statements in trace file.
    186        0  internal SQL statements in trace file.
    187        4  SQL statements in trace file.
    188        4  unique SQL statements in trace file.
    189      125  lines in trace file.
    190        0  elapsed seconds in trace file.
    191
    192

192 rows selected.
And that's it! We've generated and read a TKProf report without having to leave our SQL*Plus window. This is quite powerful and can be used in all IDEs. For SQL*Plus users, the pause and pagesize settings can make the analysis of the output easier. In grid-based IDEs such as SQL Developer, the output can easily be scrolled within the data grid.
suppressing the tkprof banner
Note lines 1-10 in the TKPROF_XT resultset above. We can see the TKProf banner twice and the reason for this is simple. The first occurrence of the banner is the stdout of running the tkprof utility (i.e. generating the TKProf report) and the second occurrence is the heading of the resulting report. To suppress the first occurrence of the banner, we can change the tkprof.sh script to redirect the stdout to /dev/null as follows.
[oracle@oel bin_dir]$ cat tkprof_no_banner.sh
#!/bin/ksh
${ORACLE_HOME}/bin/tkprof $1 $1.prf >/dev/null
/bin/cat $1.prf
We will change the TKPROF_XT table to use this script as follows.
SQL> ALTER TABLE tkprof_xt ACCESS PARAMETERS
  2  (
  3     RECORDS DELIMITED BY NEWLINE
  4     NOLOGFILE
  5     PREPROCESSOR bin_dir: 'tkprof_no_banner.sh'
  6     FIELDS TERMINATED BY WHITESPACE
  7     (
  8        line RECNUM
  9     ,  text POSITION(1:4000)
 10     )
 11  );
Table altered.
Because we'e altered the table (rather than drop and re-create it), its location will still be set to our sample trace file. We will query the first 10 rows to demonstrate the removal of the first banner as follows.
SQL> SELECT *
  2  FROM   tkprof_xt
  3  WHERE  ROWNUM <= 10;
   LINE TEXT
------- --------------------------------------------------------------------------------
      1
      2 TKPROF: Release 11.2.0.2.0 - Development on Tue Nov 8 07:35:44 2011
      3
      4 Copyright (c) 1982, 2009, Oracle and/or its affiliates.  All rights reserved.
      5
      6 Trace file: /app/oracle/diag/rdbms/ora112/ORA112/trace/ORA112_ora_5107.trc
      7 Sort options: default
      8
      9 ********************************************************************************
     10 count    = number of times OCI procedure was executed

10 rows selected.
As we can see, the TKProf banner now appears once in the output.
avoiding multiple tkprof executions
So far in this article, we've generated the same TKProf report twice (compare the timestamps at the top of each of the resultsets). This is a shortcoming of the method so far because larger trace files will take time and resources to profile. To avoid generating the TKProf report every time we query the TKPROF_XT external table, we have two options:
- we can change the preprocessor script to skip the TKProf step if the profile report already exists; or
- we can create a read-only external table to read the profile reports once they have been created.
We'll look at each of these options below.
option 1: prevent multiple invocations of tkprof
We can prevent the TKProf report being re-generated with a simple change to the preprocessor script, as follows.
[oracle@oel bin_dir]$ cat tkprof_once.sh
#!/bin/ksh
if [[ ! -f $1.prf ]]
then
   ${ORACLE_HOME}/bin/tkprof $1 $1.prf >/dev/null
fi
/bin/cat $1.prf
This version of the shell script will only generate a TKProf report if it doesn't already exist. In other words, we only get one chance to generate the profile report for each trace file (without intervention such as removing the TKProf report from the trace directory). We will modify the TKPROF_XT external table to use this new preprocessor script and query the table using the same trace file as in previous examples.
SQL> ALTER TABLE tkprof_xt ACCESS PARAMETERS
  2  (
  3     RECORDS DELIMITED BY NEWLINE
  4     NOLOGFILE
  5     PREPROCESSOR bin_dir: 'tkprof_once.sh'
  6     FIELDS TERMINATED BY WHITESPACE
  7     (
  8        line RECNUM
  9     ,  text POSITION(1:4000)
 10     )
 11  );
Table altered.
SQL> SELECT *
  2  FROM   tkprof_xt
  3  WHERE  ROWNUM <= 10;
   LINE TEXT
------- ---------------------------------------------------------------------------------
      1
      2 TKPROF: Release 11.2.0.2.0 - Development on Tue Nov 8 07:35:44 2011
      3
      4 Copyright (c) 1982, 2009, Oracle and/or its affiliates.  All rights reserved.
      5
      6 Trace file: /app/oracle/diag/rdbms/ora112/ORA112/trace/ORA112_ora_5107.trc
      7 Sort options: default
      8
      9 ********************************************************************************
     10 count    = number of times OCI procedure was executed

10 rows selected.
We can see from the highlighted timestamp that the generation of the TKProf report was skipped this time (i.e. it's the same report that we generated in an earlier example). This time we've simply read an existing report.
option 2: create a read-only external table for trace files
If we want the option to re-generate the TKProf report (should we need to), but also the efficiency of reading the resulting report many more times, then we can use the original implementation of TKPROF_XT but create a second, read-only external table for files in the user dump destination. We start by creating the read-only external table, as follows.
SQL> CREATE TABLE tracefile_xt
  2  ( line  NUMBER
  3  , text  VARCHAR2(4000)
  4  )
  5  ORGANIZATION EXTERNAL
  6  (
  7    TYPE ORACLE_LOADER
  8    DEFAULT DIRECTORY trace_dir
  9    ACCESS PARAMETERS
 10    (
 11       RECORDS DELIMITED BY NEWLINE
 12       NOLOGFILE
 13       FIELDS TERMINATED BY WHITESPACE
 14       (
 15          line RECNUM
 16       ,  text POSITION(1:4000)
 17       )
 18    )
 19    LOCATION ('')
 20  )
 21  REJECT LIMIT UNLIMITED;
Table created.
As stated, this is a vanilla external table to read from files in the TRACE_DIR Oracle directory. We'll alter the location of this table to reference our sample TKProf report and query the table as follows.
SQL> ALTER TABLE tracefile_xt LOCATION ('ORA112_ora_5107.trc.prf');
Table altered.
SQL> SELECT *
  2  FROM   tracefile_xt;
   LINE TEXT
------- ---------------------------------------------------------------------------------
      1
      2 TKPROF: Release 11.2.0.2.0 - Development on Tue Nov 8 07:35:44 2011
      3
      4 Copyright (c) 1982, 2009, Oracle and/or its affiliates.  All rights reserved.
      5
      6 Trace file: /app/oracle/diag/rdbms/ora112/ORA112/trace/ORA112_ora_5107.trc
      7 Sort options: default
      8
      9 ********************************************************************************
     10 count    = number of times OCI procedure was executed
     11 cpu      = cpu time in seconds executing
     12 elapsed  = elapsed time in seconds executing
     13 disk     = number of physical reads of buffers from disk
     14 query    = number of buffers gotten for consistent read
     15 current  = number of buffers gotten in current mode (usually for update)
     16 rows     = number of rows processed by the fetch or execute call
     17 ********************************************************************************
     18

<<...snip...>>

    173 ********************************************************************************
    174 Trace file: /app/oracle/diag/rdbms/ora112/ORA112/trace/ORA112_ora_5107.trc
    175 Trace file compatibility: 11.1.0.7
    176 Sort options: default
    177
    178        1  session in tracefile.
    179        4  user  SQL statements in trace file.
    180        0  internal SQL statements in trace file.
    181        4  SQL statements in trace file.
    182        4  unique SQL statements in trace file.
    183      125  lines in trace file.
    184        0  elapsed seconds in trace file.
    185
    186

186 rows selected.
Again, we've simply read an existing profile report. In addition to saving on TKProf executions, another benefit of this method is that we can also read raw trace files with the read-only external table. In the following example, we'll reset the location of TRACEFILE_XT to the raw trace file and run the same query.
SQL> ALTER TABLE tracefile_xt LOCATION ('ORA112_ora_5107.trc');
Table altered.
SQL> SELECT *
  2  FROM   tracefile_xt;
   LINE TEXT
------- --------------------------------------------------------------------------------
      1 Trace file /app/oracle/diag/rdbms/ora112/ORA112/trace/ORA112_ora_5107.trc
      2 Oracle Database 11g Enterprise Edition Release 11.2.0.2.0 - Production
      3 With the Partitioning, OLAP, Data Mining and Real Application Testing options
      4 ORACLE_HOME = /home/oracle/app/oracle/product/11.2.0/dbhome_2
      5 System name: Linux
      6 Node name:   oel.localdomain
      7 Release:     2.6.18-194.17.1.0.1.el5
      8 Version:     #1 SMP Wed Sep 29 15:40:03 EDT 2010
      9 Machine:     i686
     10 Instance name: ORA112
     11 Redo thread mounted by this instance: 1
     12 Oracle process number: 29
     13 Unix process pid: 5107, image: oracle@oel.localdomain
     14
     15
     16 *** 2011-11-08 07:33:17.413
     17 *** SESSION ID:(43.39) 2011-11-08 07:33:17.413
     18 *** CLIENT ID:() 2011-11-08 07:33:17.413
     19 *** SERVICE NAME:(ORA112) 2011-11-08 07:33:17.413
     20 *** MODULE NAME:(SQL*Plus) 2011-11-08 07:33:17.413
     21 *** ACTION NAME:() 2011-11-08 07:33:17.413
     22
     23 WAIT #10101528: nam='SQL*Net message to client' ela= 9 driver id=1413697536 #bytes=1 p3=0 obj#=-1 tim=1320737597413255
     24 WAIT #10101528: nam='SQL*Net message from client' ela= 289 driver id=1413697536 #bytes=1 p3=0 obj#=-1 tim=1320737597413799
     25 =====================

<<...snip...>>

     84 =====================
     85 PARSING IN CURSOR #12087624 len=24 dep=0 uid=84 oct=3 lid=84 tim=1320737597478529 hv=927671276 ad='35e71828' sqlid='7ryz6qnvnq8zc'
     86 SELECT COUNT(*) FROM emp
     87 END OF STMT
     88 PARSE #12087624:c=6999,e=39587,p=0,cr=9,cu=0,mis=1,r=0,dep=0,og=1,plh=1006289799,tim=1320737597478529
     89 EXEC #12087624:c=0,e=91,p=0,cr=0,cu=0,mis=0,r=0,dep=0,og=1,plh=1006289799,tim=1320737597478620
     90 WAIT #12087624: nam='SQL*Net message to client' ela= 10 driver id=1413697536 #bytes=1 p3=0 obj#=-1 tim=1320737597478681
     91 FETCH #12087624:c=0,e=113,p=0,cr=4,cu=0,mis=0,r=1,dep=0,og=1,plh=1006289799,tim=1320737597478839
     92 STAT #12087624 id=1 cnt=1 pid=0 pos=1 obj=0 op='SORT AGGREGATE (cr=4 pr=0 pw=0 time=112 us)'
     93 STAT #12087624 id=2 cnt=14 pid=1 pos=1 obj=73182 op='INDEX FAST FULL SCAN PK_EMP (cr=4 pr=0 pw=0 time=98 us cost=2 size=0 card=14)'
     94 WAIT #12087624: nam='SQL*Net message from client' ela= 536 driver id=1413697536 #bytes=1 p3=0 obj#=-1 tim=1320737597479517
     95 FETCH #12087624:c=0,e=2,p=0,cr=0,cu=0,mis=0,r=0,dep=0,og=0,plh=1006289799,tim=1320737597479606
     96 WAIT #12087624: nam='SQL*Net message to client' ela= 3 driver id=1413697536 #bytes=1 p3=0 obj#=-1 tim=1320737597479639
     97 WAIT #12087624: nam='SQL*Net message from client' ela= 2104 driver id=1413697536 #bytes=1 p3=0 obj#=-1 tim=1320737597481762
     98 PARSE #10096824:c=0,e=64,p=0,cr=0,cu=0,mis=0,r=0,dep=0,og=1,plh=0,tim=1320737597481942
     99 BINDS #10096824:
    100  Bind#0
    101   oacdty=123 mxl=4000(4000) mxlc=00 mal=00 scl=00 pre=00
    102   oacflg=00 fl2=1000000 frm=00 csi=00 siz=4000 off=0
    103 toid ptr value=352B9774 length=16
    104 7113C953AF16A09FE040E40ADCDE1DC9
    105   kxsbbbfp=00b88c54  bln=4000  avl=00  flg=15

<<...snip...>>

    120 =====================
    121 PARSING IN CURSOR #12087624 len=55 dep=0 uid=84 oct=42 lid=84 tim=1320737597484265 hv=2655499671 ad='0' sqlid='0kjg1c2g4gdcr'
    122 ALTER SESSION SET EVENTS '10046 trace name context off'
    123 END OF STMT
    124 PARSE #12087624:c=0,e=58,p=0,cr=0,cu=0,mis=0,r=0,dep=0,og=0,plh=0,tim=1320737597484264
    125 EXEC #12087624:c=0,e=365,p=0,cr=0,cu=0,mis=0,r=0,dep=0,og=0,plh=0,tim=1320737597484709

125 rows selected.
We can see the benefit of having a preprocessor external table to initially generate and read a TKProf report together with a generic read-only external table for reading any trace file or profile thereafter. With these, we never have to leave our IDE to work with trace files or profiler reports.
further productivity improvements
If we consider the steps we usually take to profile a trace file, they might include the following:
- exit SQL*Plus or leave the SQL*Plus terminal (or other IDE window);
- start another terminal window and connect to the database server;
- navigate to the trace directory;
- identify the trace file;
- run the tkprof utility to generate the report;
- open the report in an editor.
So far, we've managed to reduce these steps to identifying our default trace file, setting the external table location and querying the preprocessor external table. These are significant productivity improvements. We can take this even further by encapsulating these remaining tasks in either a SQL*Plus script or in a pipelined function.
option 1: using a utility script
Most SQL*Plus users will set a SQLPATH location for utility scripts (including the login.sql script, for example), meaning they are available in SQL*Plus regardless of the current working directory. We can add a small script to our SQLPATH directory to encapsulate the TKProf tasks shown in the previous examples. The following is an example of what a script might look like.
-- tkprof.sql
-- ---------------------------------------------------------

-- Initialise "1" to enable an optional script parameter...
set termout off
col 1 new_value 1
SELECT NULL AS "1"
FROM   dual
WHERE  1=2;

-- Set the tracefile name (if not supplied, fetch it)...
col tracefile new_value _tracefile
SELECT CASE
          WHEN '&1' IS NOT NULL
          THEN '&1'
          ELSE REGEXP_SUBSTR(value, '[^/]+$')
       END AS tracefile
FROM   v$diag_info
WHERE  name = 'Default Trace File';

-- Set the external table location...
ALTER TABLE tkprof_xt LOCATION ('&_tracefile');

-- Query the external table...
set termout on
set lines 150
col text format a130
SELECT *
FROM   tkprof_xt;

undefine "1"
undefine _tracefile
We can see that this script contains each of the steps needed to prepare and query the external table. Note that this script will accept the name of the trace file, but if it is not supplied, it will use the default trace file for our current session (which is what we've been using throughout this article). Using the script is, of course, very simple, as demonstrated below.
SQL> @tkprof
   LINE TEXT
------- --------------------------------------------------------------------------------
      1
      2 TKPROF: Release 11.2.0.2.0 - Development on Tue Nov 8 07:35:44 2011
      3
      4 Copyright (c) 1982, 2009, Oracle and/or its affiliates.  All rights reserved.
      5
      6 Trace file: /app/oracle/diag/rdbms/ora112/ORA112/trace/ORA112_ora_5107.trc
      7 Sort options: default
      8
      9 ********************************************************************************
     10 count    = number of times OCI procedure was executed
     11 cpu      = cpu time in seconds executing
     12 elapsed  = elapsed time in seconds executing
     13 disk     = number of physical reads of buffers from disk
     14 query    = number of buffers gotten for consistent read
     15 current  = number of buffers gotten in current mode (usually for update)
     16 rows     = number of rows processed by the fetch or execute call
     17 ********************************************************************************
     18

<<...snip...>>

186 rows selected.
With this script, we've reduced the steps needed to generate and read a TKProf report to a single call.
option 2: using a pipelined function
An alternative to using a free-standing SQL script is to create a pipelined function to perform these tasks. This will be particularly useful for users of IDEs such as SQL Developer and TOAD. As with all pipelined functions, we need an object type to describe our output row and a collection of this type for the function to return. We create these as follows.
SQL> CREATE TYPE tkprof_ot AS OBJECT
  2  ( line NUMBER
  3  , text VARCHAR2(4000)
  4  );
  5  /
Type created.
SQL> CREATE TYPE tkprof_ntt AS TABLE OF tkprof_ot;
  2  /
Type created.
The output of the function will be quite simple: just a line number and the text of the report itself. We create the pipelined function as follows.
SQL> CREATE FUNCTION tkprof (
  2                  p_tracefile IN VARCHAR2 DEFAULT NULL
  3                  ) RETURN tkprof_ntt PIPELINED AS
  4
  5     -----------------------------------------------------
  6     FUNCTION get_tracefile RETURN VARCHAR2 IS
  7        v_tracefile VARCHAR2(128);
  8     BEGIN
  9        SELECT REGEXP_SUBSTR(value, '[^/]+$')
 10        INTO   get_tracefile.v_tracefile
 11        FROM   v$diag_info
 12        WHERE  name = 'Default Trace File';
 13        RETURN get_tracefile.v_tracefile;
 14     END get_tracefile;
 15
 16     -----------------------------------------------------
 17     PROCEDURE set_location( p_tracefile IN VARCHAR2 ) IS
 18        PRAGMA AUTONOMOUS_TRANSACTION;
 19     BEGIN
 20        EXECUTE IMMEDIATE
 21           'ALTER TABLE tkprof_xt LOCATION (''' ||
 22               set_location.p_tracefile || ''')';
 23     END set_location;
 24
 25  BEGIN
 26
 27     /* Set the external table location... */
 28     set_location(COALESCE(p_tracefile, get_tracefile));
 29
 30     /* Pipe the data... */
 31     FOR r IN (SELECT * FROM tkprof_xt) LOOP
 32        PIPE ROW (tkprof_ot(r.line, r.text));
 33     END LOOP;
 34
 35     RETURN;
 36
 37  EXCEPTION
 38     WHEN NO_DATA_NEEDED THEN
 39        NULL;
 40  END tkprof;
 41  /
Function created.
Some points to note are as follows:
- Line 2: the function has an optional parameter that allows us to pass in the name of the SQL trace file if we know it;
- Lines 6-14: we include a function to lookup the default trace file name in the event that the p_tracefile parameter is not provided;
- Line 17-23: we also include a procedure to set the location of the external table;
- Line 28 and Lines 31-33: we set the location, read from the external table and pipe out the resultset.
We will test our function without a trace file name, as follows.
SQL> SELECT *
  2  FROM   TABLE(tkprof);
   LINE TEXT
------- ---------------------------------------------------------------------------------
      1
      2 TKPROF: Release 11.2.0.2.0 - Development on Tue Nov 8 07:35:44 2011
      3
      4 Copyright (c) 1982, 2009, Oracle and/or its affiliates.  All rights reserved.
      5
      6 Trace file: /app/oracle/diag/rdbms/ora112/ORA112/trace/ORA112_ora_5107.trc
      7 Sort options: default
      8
      9 ********************************************************************************
     10 count    = number of times OCI procedure was executed
     11 cpu      = cpu time in seconds executing
     12 elapsed  = elapsed time in seconds executing
     13 disk     = number of physical reads of buffers from disk
     14 query    = number of buffers gotten for consistent read
     15 current  = number of buffers gotten in current mode (usually for update)
     16 rows     = number of rows processed by the fetch or execute call
     17 ********************************************************************************
     18

<<...snip...>>

186 rows selected.
other profilers (orasrp)
In addition to the supplied TKProf utility, it's possible to use a preprocessor external table to generate and read any other executable profilers that generate text-based reports. We'll see an example of this with the excellent OraSRP profiler. Like TKProf, OraSRP is a command-line utility but has the added benefit of generating a fully-navigable HTML report in addition to a standard text format.
We'll begin by creating a preprocessor external table for generating OraSRP reports, as follows.
SQL> CREATE TABLE orasrp_xt
  2  ( line  NUMBER
  3  , text  VARCHAR2(4000)
  4  )
  5  ORGANIZATION EXTERNAL
  6  (
  7    TYPE ORACLE_LOADER
  8    DEFAULT DIRECTORY trace_dir
  9    ACCESS PARAMETERS
 10    (
 11       RECORDS DELIMITED BY NEWLINE
 12       NOLOGFILE
 13       PREPROCESSOR bin_dir: 'orasrp.sh'
 14       FIELDS TERMINATED BY WHITESPACE
 15       (
 16          line RECNUM
 17       ,  text POSITION(1:4000)
 18       )
 19    )
 20    LOCATION ('')
 21  )
 22  REJECT LIMIT UNLIMITED;
Table created.
This is almost a carbon-copy of TKPROF_XT example from above. The orasrp.sh preprocessor script in this case is as follows.
[oracle@oel bin_dir]$ cat orasrp.sh
#!/bin/ksh
/app/oracle/orasrp/orasrp -t $1 $1.orasrp
/bin/cat $1.orasrp
Note that for these examples, the OraSRP utility is available on the database server itself, so it is able to access trace files in the same way as the server-side TKProf utility (a workaround for readers with client-side access only is described later). In this first example, we're generating a text profile report with a naming format of <tracefile>.orasrp. We'll test it with the sample trace file we've used so far, as follows.
SQL> ALTER TABLE orasrp_xt LOCATION ('ORA112_ora_5107.trc');
Table altered.
SQL> SELECT *
  2  FROM   orasrp_xt;
   LINE TEXT
------- -------------------------------------------------------------------
      1
      2 Session Summary
      3 ==================================================
      4 Instance Name: ORA112
      5 Node Name: oel.localdomain
      6 Oracle Release: 11.2.0.2.0
      7 Session ID: 43.39
      8 Total SQL Statements: 4 (4 user statements, 0 internal statements)
      9 Total Transactions: 0 (0 rollback(s), 0 read-only)
     10
     11
     12 Session Flat Profile
     13 ==================================================
     14                                                                              ----------- Time Per Call ---------
     15 Event Name                                  % Time       Seconds      Calls          Avg         Min         Max
     16 ----------------------------------------  --------  ------------  ---------  ----------- ----------- -----------
     17 unaccounted-for time                         76.5%       0.0544s
     18 EXEC calls [CPU]                              8.4%       0.0060s          5      0.0012s     0.0000s     0.0030s
     19 SQL*Net message from client [idle]            5.6%       0.0040s          3      0.0013s     0.0003s     0.0021s
     20 PARSE calls [CPU]                             5.6%       0.0040s          5      0.0008s     0.0000s     0.0030s
     21 SQL*Net message from client                   3.6%       0.0026s          2      0.0013s     0.0005s     0.0021s
     22 Disk file operations I/O                      0.1%       0.0001s          1      0.0001s     0.0001s     0.0001s
     23 SQL*Net message to client                     0.1%       0.0000s          5      0.0000s     0.0000s     0.0000s
     24 FETCH calls [CPU]                             0.0%       0.0000s          3      0.0000s     0.0000s     0.0000s
     25 ----------------------------------------  --------  ------------  ---------  ----------- ----------- -----------
     26 Total                                       100.0%       0.0711s
     27

<< ...snip... >>

    442 ********************************************************************************
    443
    444 Generated by OraSRP v4.1.2 beta    http://oracledba.ru/orasrp

444 rows selected.
As with the TKPROF_XT examples, we can apply all the same resource-saving measures to the OraSRP equivalent, such as avoiding repeated report-generations for the same trace file. We can also apply productivity-measures such as a script or pipelined function utility fetch the tracefile name, set the location and query the external table in a single call.
As noted above, this example needs the OraSRP utility to be located on the database server. If this isn't possible, then there is a workaround, but this requires that the OraSRP utility is available on the client machine and also that the read-only TRACEFILE_XT external table can access trace files located in the user dump destination. Putting the following steps into a script can be an exercise for the reader.
- 1) determine the raw trace file name;
- 2) set the location of the TRACEFILE_XT external table;
- 3) turn off all SQL*Plus formatting and start a spool file;
- 4) query the TRACEFILE_XT table;
- 5) turn off the spool;
- 6) make a host call to orasrp to profile the spooled trace file to a new report;
- 7) make a host call to start the report file (for example, if this is saved as a .txt file on a Windows client, it will open in Notepad).
Note that with the above workaround, there is a risk that large volumes of raw trace file data could be transferred from the database server to the client machine. Wherever possible, this technique should be avoided and all work performed on the server itself (although this isn't always possible in controlled environments).
orasrp html reports
The OraSRP text report is extremely useful in its own right, but it is the HTML version of the report that adds an enormous amount of value over TKProf. We can easily transform our example to benefit from the HTML report format. First, we'll create a shell script to generate the OraSRP report as HTML for our external table.
[oracle@oel bin_dir]$ cat orasrp_html.sh
#!/bin/ksh
/app/oracle/orasrp/orasrp $1 $1.orasrp.html
/bin/cat $1.orasrp.html
We'll also modify the access parameters of the external table to reference this new script, as follows.
SQL> ALTER TABLE orasrp_xt ACCESS PARAMETERS
  2  (
  3     RECORDS DELIMITED BY NEWLINE
  4     NOLOGFILE
  5     PREPROCESSOR bin_dir: 'orasrp_html.sh'
  6     FIELDS TERMINATED BY WHITESPACE
  7     (
  8        line RECNUM
  9     ,  text POSITION(1:4000)
 10     )
 11  );
Table altered.
We can demonstrate the new format by generating an HTML report and fetching a few rows, as follows.
SQL> SELECT *
  2  FROM   orasrp_xt
  3  WHERE  ROWNUM <= 10;
   LINE TEXT
------- ------------------------------------------------------------
      1 <!DOCTYPE html>
      2 <html>
      3 <head>
      4 <!--                                         -->
      5 <!-- Generated by:                           -->
      6 <!-- OraSRP v4.1.2 beta                      -->
      7 <!-- Copyright (c) 2006-2011, Egor Starostin -->
      8 <!-- Written in D programming language       -->
      9 <!--                                         -->
     10 <!--                                         -->

10 rows selected.
Of course, being in HTML format means that we need to view it in a browser, so we'll use the tkprof.sql script example from earlier as a template and create a convenient orasrp.sql script to set the external table location, spool the HTML report to a flat-file and open the report in a browser. The orasrp.sql script is as follows (it allows for both Windows and *nix clients).
-- orasrp.sql
-- ---------------------------------------------------------

-- Setup for Windows or *nix client...
  define _browser_cmd = "start"       -- Windows
  define _tmpdir      = "C:\Temp"     -- Windows
--define _browser_cmd = "firefox"     -- *nix
--define _tmpdir      = "/tmp"        -- *nix

-- Initialise "1" to enable an optional script parameter...
set termout off
col 1 new_value 1
SELECT NULL AS "1"
FROM   dual
WHERE  1=2;

-- Set the tracefile name (if not supplied, fetch it)...
col tracefile new_value _tracefile
SELECT CASE
          WHEN '&1' IS NOT NULL
          THEN '&1'
          ELSE REGEXP_SUBSTR(value, '[^/]+$')
       END AS tracefile
FROM   v$diag_info
WHERE  name = 'Default Trace File';

-- Set the external table location...
ALTER TABLE orasrp_xt LOCATION ('&_tracefile');

-- Store the sqlplus settings...
store set &_tmpdir/sqlplus_settings.sql replace

-- Query the external table and spool to file...
set head off pages 0 lines 2000 trimspool on feed off echo off
col text format a4000
spool &_tmpdir/&_tracefile..html
SELECT text
FROM   orasrp_xt;
spool off

-- Open the HTML report in a browser...
host &_browser_cmd &_tmpdir/&_tracefile..html &

-- Restore settings...
@&_tmpdir/sqlplus_settings.sql
set termout on
undefine "1"
undefine _tracefile
undefine _browser_cmd
undefine _tmpdir
This version of the script is setup to display the OraSRP report in a browser on a Windows client (see the two variables defined at the top of the script). We will test this script with the trace file we've been using for all our examples, as follows.
SQL> @orasrp ORA112_ora_5107.trc
When the script completes, the following OraSRP report is opened in the web browser.
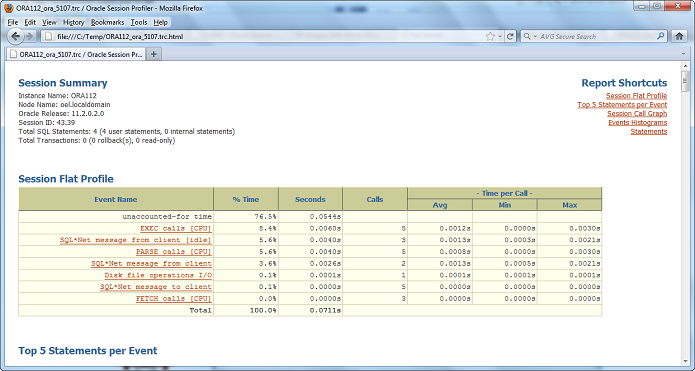
Of course, with this example we need to leave SQL*Plus for a web browser, but at least it costs no additional keystrokes or mouse-clicks and automatically takes the foreground focus! We also get the benefit of the full navigation of the HTML OraSRP report.
listing available trace files
All of the examples have used either the session's default trace file or a known trace file name throughout. We will probably want to profile trace files created outside of our own sessions, so for this we need to be able to list the available files. A preprocessor external table is perfect for this. In fact, one of the recommended background articles (listing files with the external table preprocessor in 11g) is dedicated to this very subject, but the examples in that article list files on a Windows database server. Therefore a short UNIX/Linux version is provided below. Note, however, that for any detailed commentary regarding this technique, readers should see the original article.
We'll begin by creating the preprocessor external table, as follows.
SQL> CREATE TABLE tracefiles_xt
  2  ( permissions      VARCHAR2(10)
  3  , links            NUMBER
  4  , owner            VARCHAR2(30)
  5  , group_name       VARCHAR2(30)
  6  , bytes            NUMBER
  7  , mon              VARCHAR2(3)
  8  , day              NUMBER
  9  , hhmi_or_yyyy     VARCHAR2(5)
 10  , file_name        VARCHAR2(255)
 11  )
 12  ORGANIZATION EXTERNAL
 13  (
 14    TYPE ORACLE_LOADER
 15    DEFAULT DIRECTORY trace_dir
 16    ACCESS PARAMETERS
 17    (
 18       RECORDS DELIMITED BY NEWLINE
 19       NOBADFILE
 20       NOLOGFILE
 21       PREPROCESSOR bin_dir: 'tracefiles.sh'
 22       FIELDS TERMINATED BY WHITESPACE
 23    )
 24    LOCATION (bin_dir:'tracefiles_xt.txt')
 25  )
 26  REJECT LIMIT UNLIMITED;
Table created.
As described in the referenced article, the file in the location clause (line 24) can be empty but must exist. The preprocessor script that supports this external table is a very simple directory long-listing, as follows.
[oracle@oel bin_dir]$ cat tracefiles.sh
#!/bin/ksh
/bin/ls -l /app/oracle/diag/rdbms/ora112/ORA112/trace
To complete the setup of the file-listing utility, we'll format the output data with a view over the external table, as below.
SQL> CREATE OR REPLACE VIEW tracefiles_vxt
  2  AS
  3     SELECT permissions
  4     ,      owner
  5     ,      group_name
  6     ,      bytes
  7     ,      TO_DATE(mon || TO_CHAR(day, 'fm09') || hhmi_or_yyyy,
  8                    'MonDD' || CASE
  9                                  WHEN hhmi_or_yyyy LIKE '%:%'
 10                                  THEN 'HH24:MI'
 11                                  ELSE 'YYYY'
 12                               END) AS file_date
 13     ,      file_name
 14     FROM   tracefiles_xt
 15     WHERE  permissions NOT LIKE 'd%';
View created.
Note that directories are excluded from the output (as we're only interested in trace files). Getting a sample listing of the existing trace files is as simple as querying the view, as follows.
SQL> SELECT *
  2  FROM   tracefiles_vxt
  3  WHERE  file_name LIKE '%.trc'
  4  ORDER  BY
  5         file_date;
PERMISSIONS OWNER      GROUP_NAME      BYTES FILE_DATE           FILE_NAME
----------- ---------- ---------- ---------- ------------------- ---------------------
-rw-rw----  oracle     oracle            858 28/10/2011 06:55:00 ORA112_mman_4396.trc
-rw-rw----  oracle     oracle            784 28/10/2011 06:55:00 ORA112_ora_4352.trc
-rw-rw----  oracle     oracle           1154 28/10/2011 06:56:00 ORA112_n000_4478.trc
-rw-rw----  oracle     oracle           1154 28/10/2011 06:56:00 ORA112_n000_4476.trc
-rw-rw----  oracle     oracle           1070 28/10/2011 06:56:00 ORA112_ora_4454.trc
-rw-rw----  oracle     oracle           1789 28/10/2011 06:56:00 ORA112_pmon_4380.trc
-rw-rw----  oracle     oracle           1154 28/10/2011 06:56:00 ORA112_n000_4472.trc
-rw-rw----  oracle     oracle           1154 28/10/2011 06:56:00 ORA112_n000_4482.trc
-rw-rw----  oracle     oracle           1154 28/10/2011 06:56:00 ORA112_n000_4458.trc
-rw-rw----  oracle     oracle           1154 28/10/2011 06:56:00 ORA112_n000_4474.trc
-rw-rw----  oracle     oracle           1154 28/10/2011 06:56:00 ORA112_n000_4470.trc
-rw-rw----  oracle     oracle           1154 28/10/2011 06:56:00 ORA112_n000_4468.trc
-rw-rw----  oracle     oracle           3115 28/10/2011 06:59:00 ORA112_ora_4538.trc
-rw-rw----  oracle     oracle           3118 28/10/2011 07:07:00 ORA112_ora_4564.trc
-rw-rw----  oracle     oracle           2993 28/10/2011 07:13:00 ORA112_ora_4782.trc

<<...snip...>>

121 rows selected.
summary
Using the simple techniques described in this article, we are now able to find a trace file, read it using the TRACEFILE_XT read-only external table, profile it with preprocessor external tables over TKProf or OraSRP and read the reports without leaving our IDE once. We can even read HTML reports in a browser window generated from within SQL*Plus without any additional keystrokes. For readers who work regularly with trace files, these are good productivity improvements!
further reading
See the further reading references in the oracle-developer.net articles listed at the top of this article. More information on OraSRP is available in this README.
source code
The source code for the examples in this article can be downloaded from here.
Adrian Billington, November 2011
Back to Top